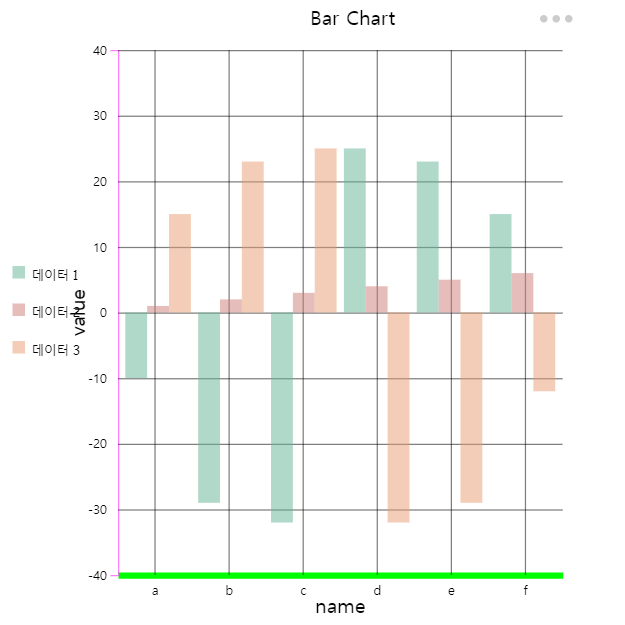
Bar Chart - Vertical
This chart that represents categorical data as vertical rectangular bars with height and length proportional to the representation values.
 Bar Chart Detail
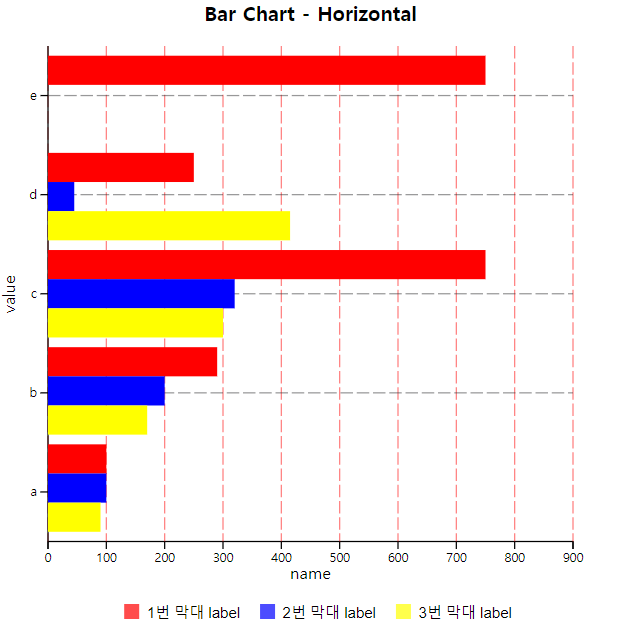
 Bar Chart - Horizontal
This chart that represents categorical data as horizontal rectangular bars with height and length proportional to the representation values.
 Bar chart Detail
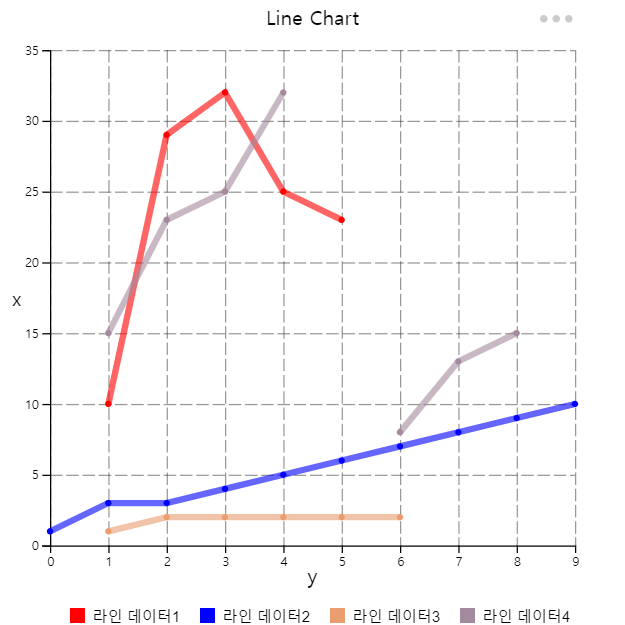
 Line Chart
This chart that uses lines to show how different pieces of information are related to each other.
Line Chart Detail

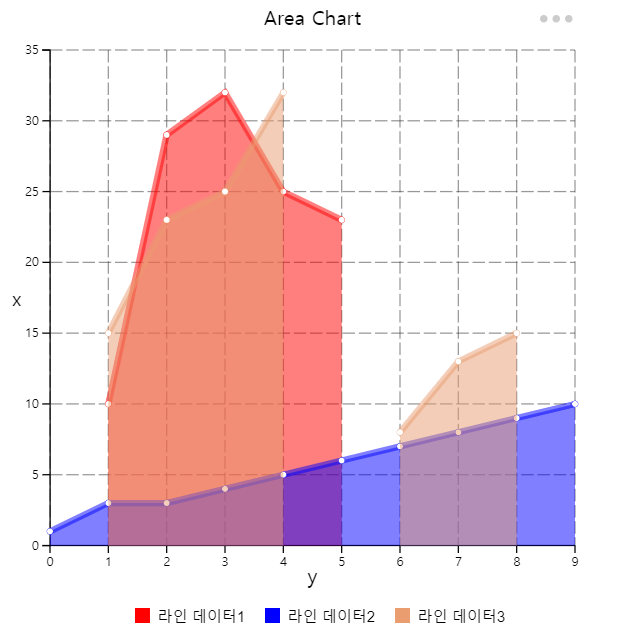
Area Chart
This chart which is based on the line chart displays graphically quantitative data. The area between axis and line are commonly emphasized with colors, textures and hatchings. Commonly one compares two or more quantities with an area chart.
 Area Chart Detail
Scatter Chart
This chart is a type of plot or mathematical diagram using coordinates to display values for typically two variables for a set of data. The data are displayed as a collection of points on the horizontal axis and the vertical axis.
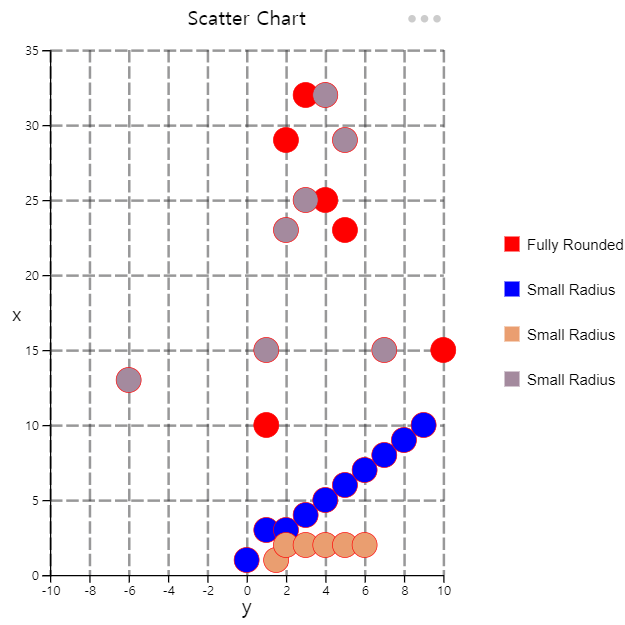 Scatter Chart Detail
Bubble Chart
This chart displays three dimensions of data. Each entity is plotted as a disk that express two of the values through the disk's x-axis and y-axis and the thrid thrugh its size.
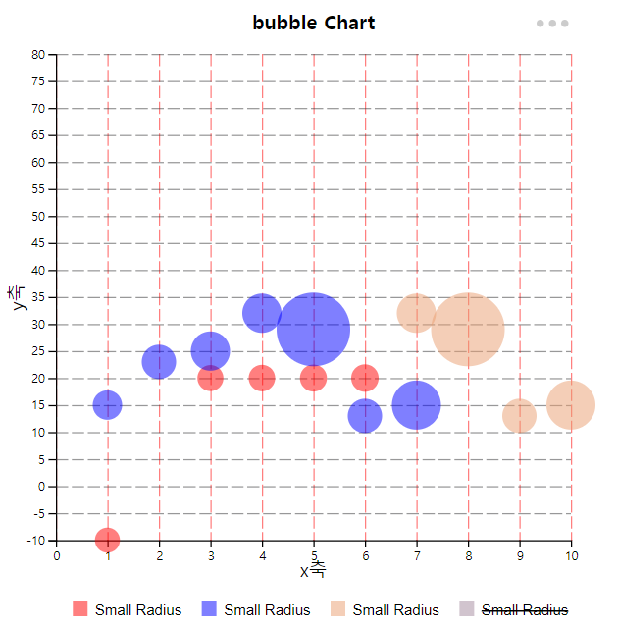 Bubble Chart Detail
 Pie Chart
This chart is a graph showing the ratio of each part to the whole as a percentage in a fan shape. The central angle of each sector represents the proportion of the total, and has the advantage of being able to see the ratio at a glance.
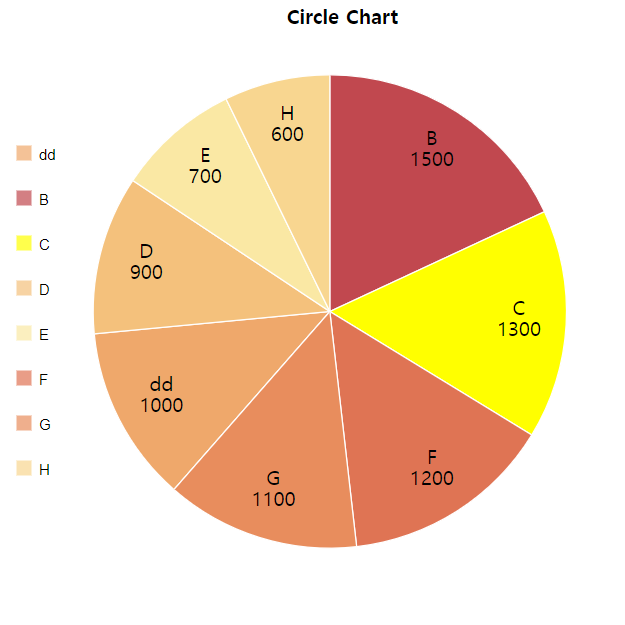 Pie Chart Detail
Donut Chart
This chart is shaped like a donut with a hole in the middle. All its functions and characteristics are based on pie chart.
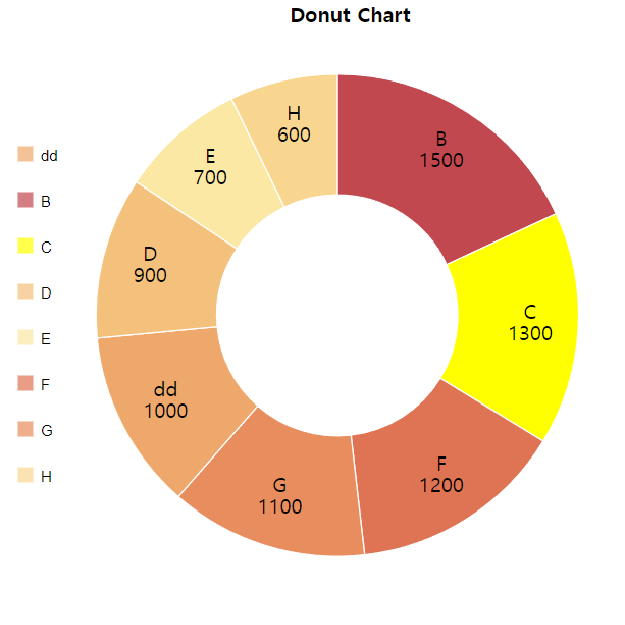 Donut Chart Detail
 Radar Chart
This is a diagram that divides various evaluation items into polygons according to the number of items, draws points according to the score of the items, and connects the points to form a line so that the balance between items can be seen at a glance.
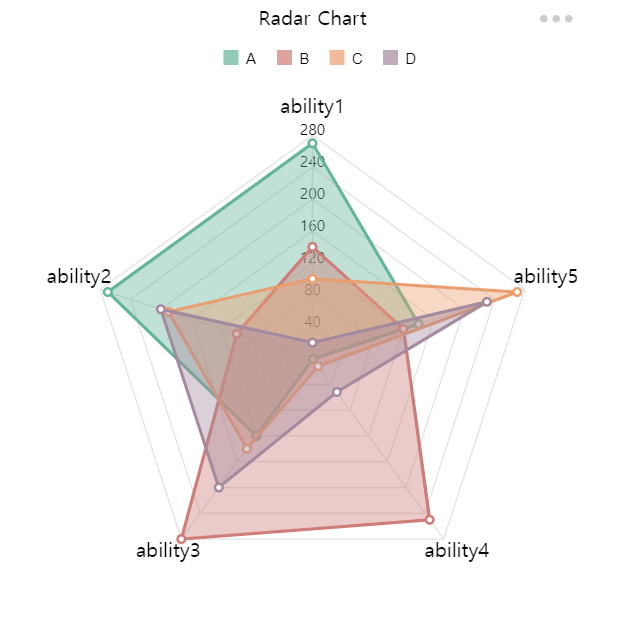 Radar Chart Detail
Polar Chart
Polar charts are similar to pie charts, but each dataset has the same angle. Each data set has a different radius size depending on the value. Useful when displaying comparison data similar to pie charts.
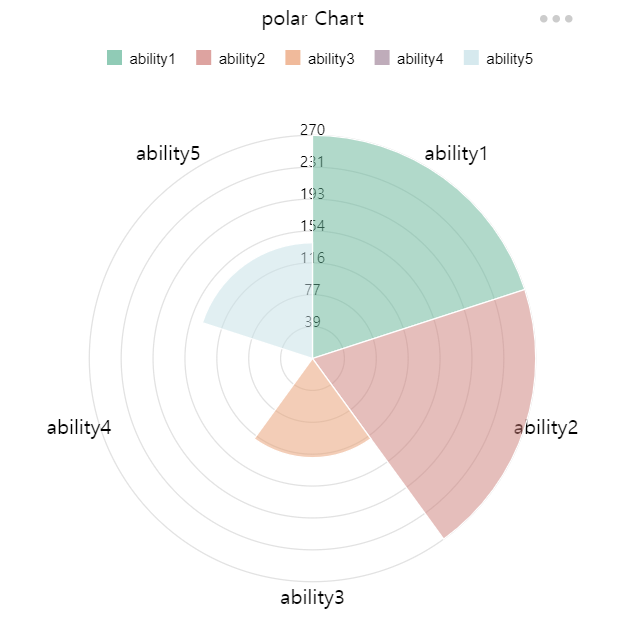 Polar Chart Detail